There were some amount of issues raised and discussed about the Eddy and how it works in the past.
I would try to sum them up and try to address them.
- Homing inconsistency/noise.
- Probe offset.
- ''Eddy current sensor error"
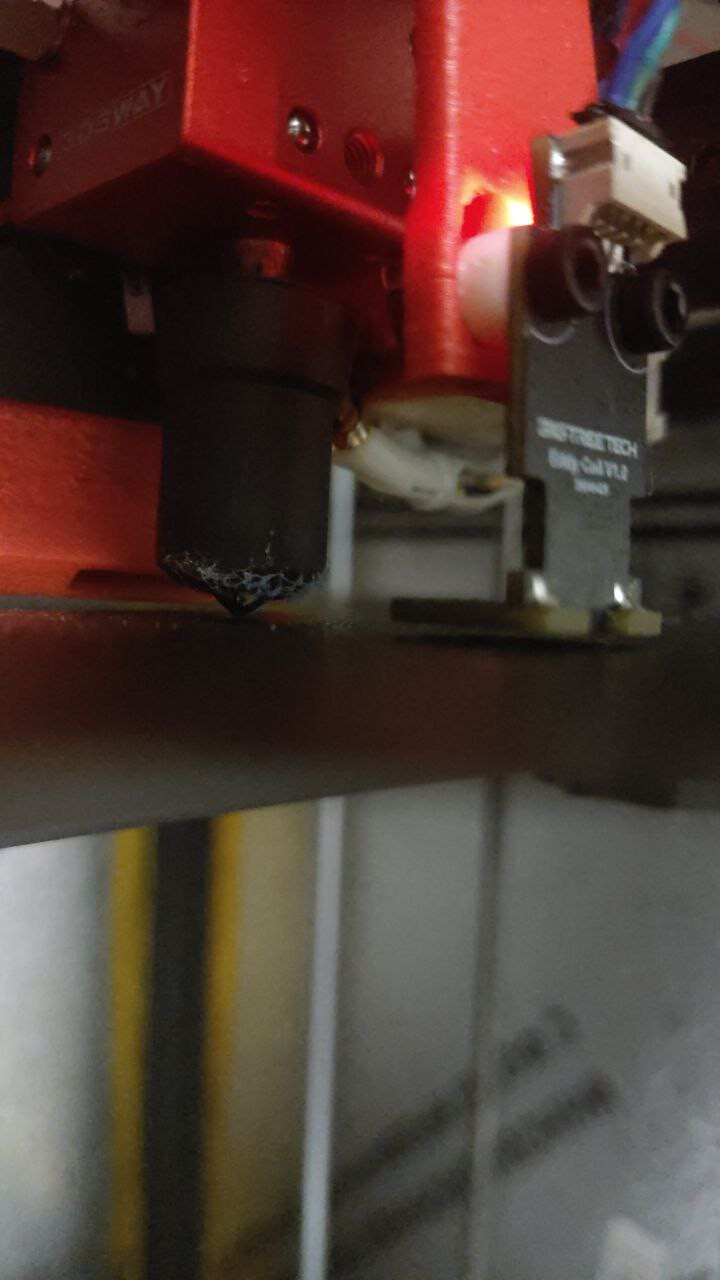
Let’s start from the beginning. BTT Eddy, Cartographer, Beacon are basically the same sensors.
They are all just LDC1612. They all just use a single LC coil, where the sensor creates resonance and measure it’s frequency, to be more specific amount of peaks in the unit of time.

That is it.
The sensor gives us 28bit some number which we can convert to the frequency, and it is somewhat precies.
Frequency depends on the internal LC tank characteristics, so it should be somewhat consistent between sensors with the same coil. Basically, we can expect that 2 eddies would have a similar frequency response, and 2 cartos and 2 beacons.
Then there are some variables:
- Temperature would shift the resonance frequency and amplitude lower (probably because of PCB thermal expansion).
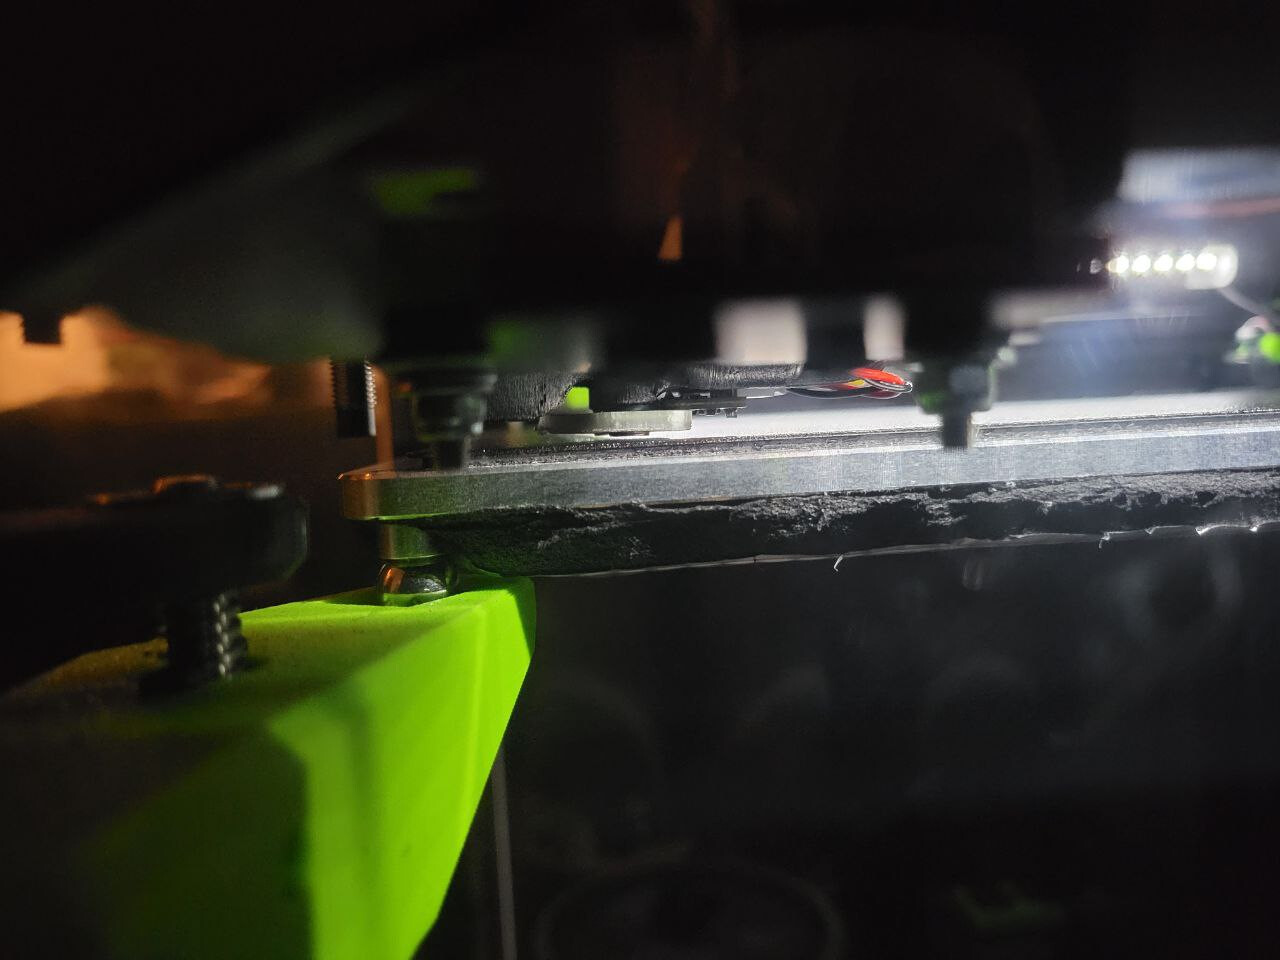
- Distance between the sensor coil and the coupled metal objects (bed in our case). The closer the sensor gets, the higher the frequency would be, and the lower the amplitude would be.
If we read the datasheet carefully, we can spot that the resonance frequency/distance relation is not linear.

It is asymptotic. Frequency goes to “infinity” the closer the sensor gets to the bed, and on the other side, frequency goes flat (technically, it should represent the coil resonance frequency).
I initially did some research on this topic here: Cartographer V3: Reverse engineering - #4 by nefelim4ag. There are carto-related measurements.
Then I was able to humbly ask some people for help gathering data about BTT Eddy.
Many thanks to these people.
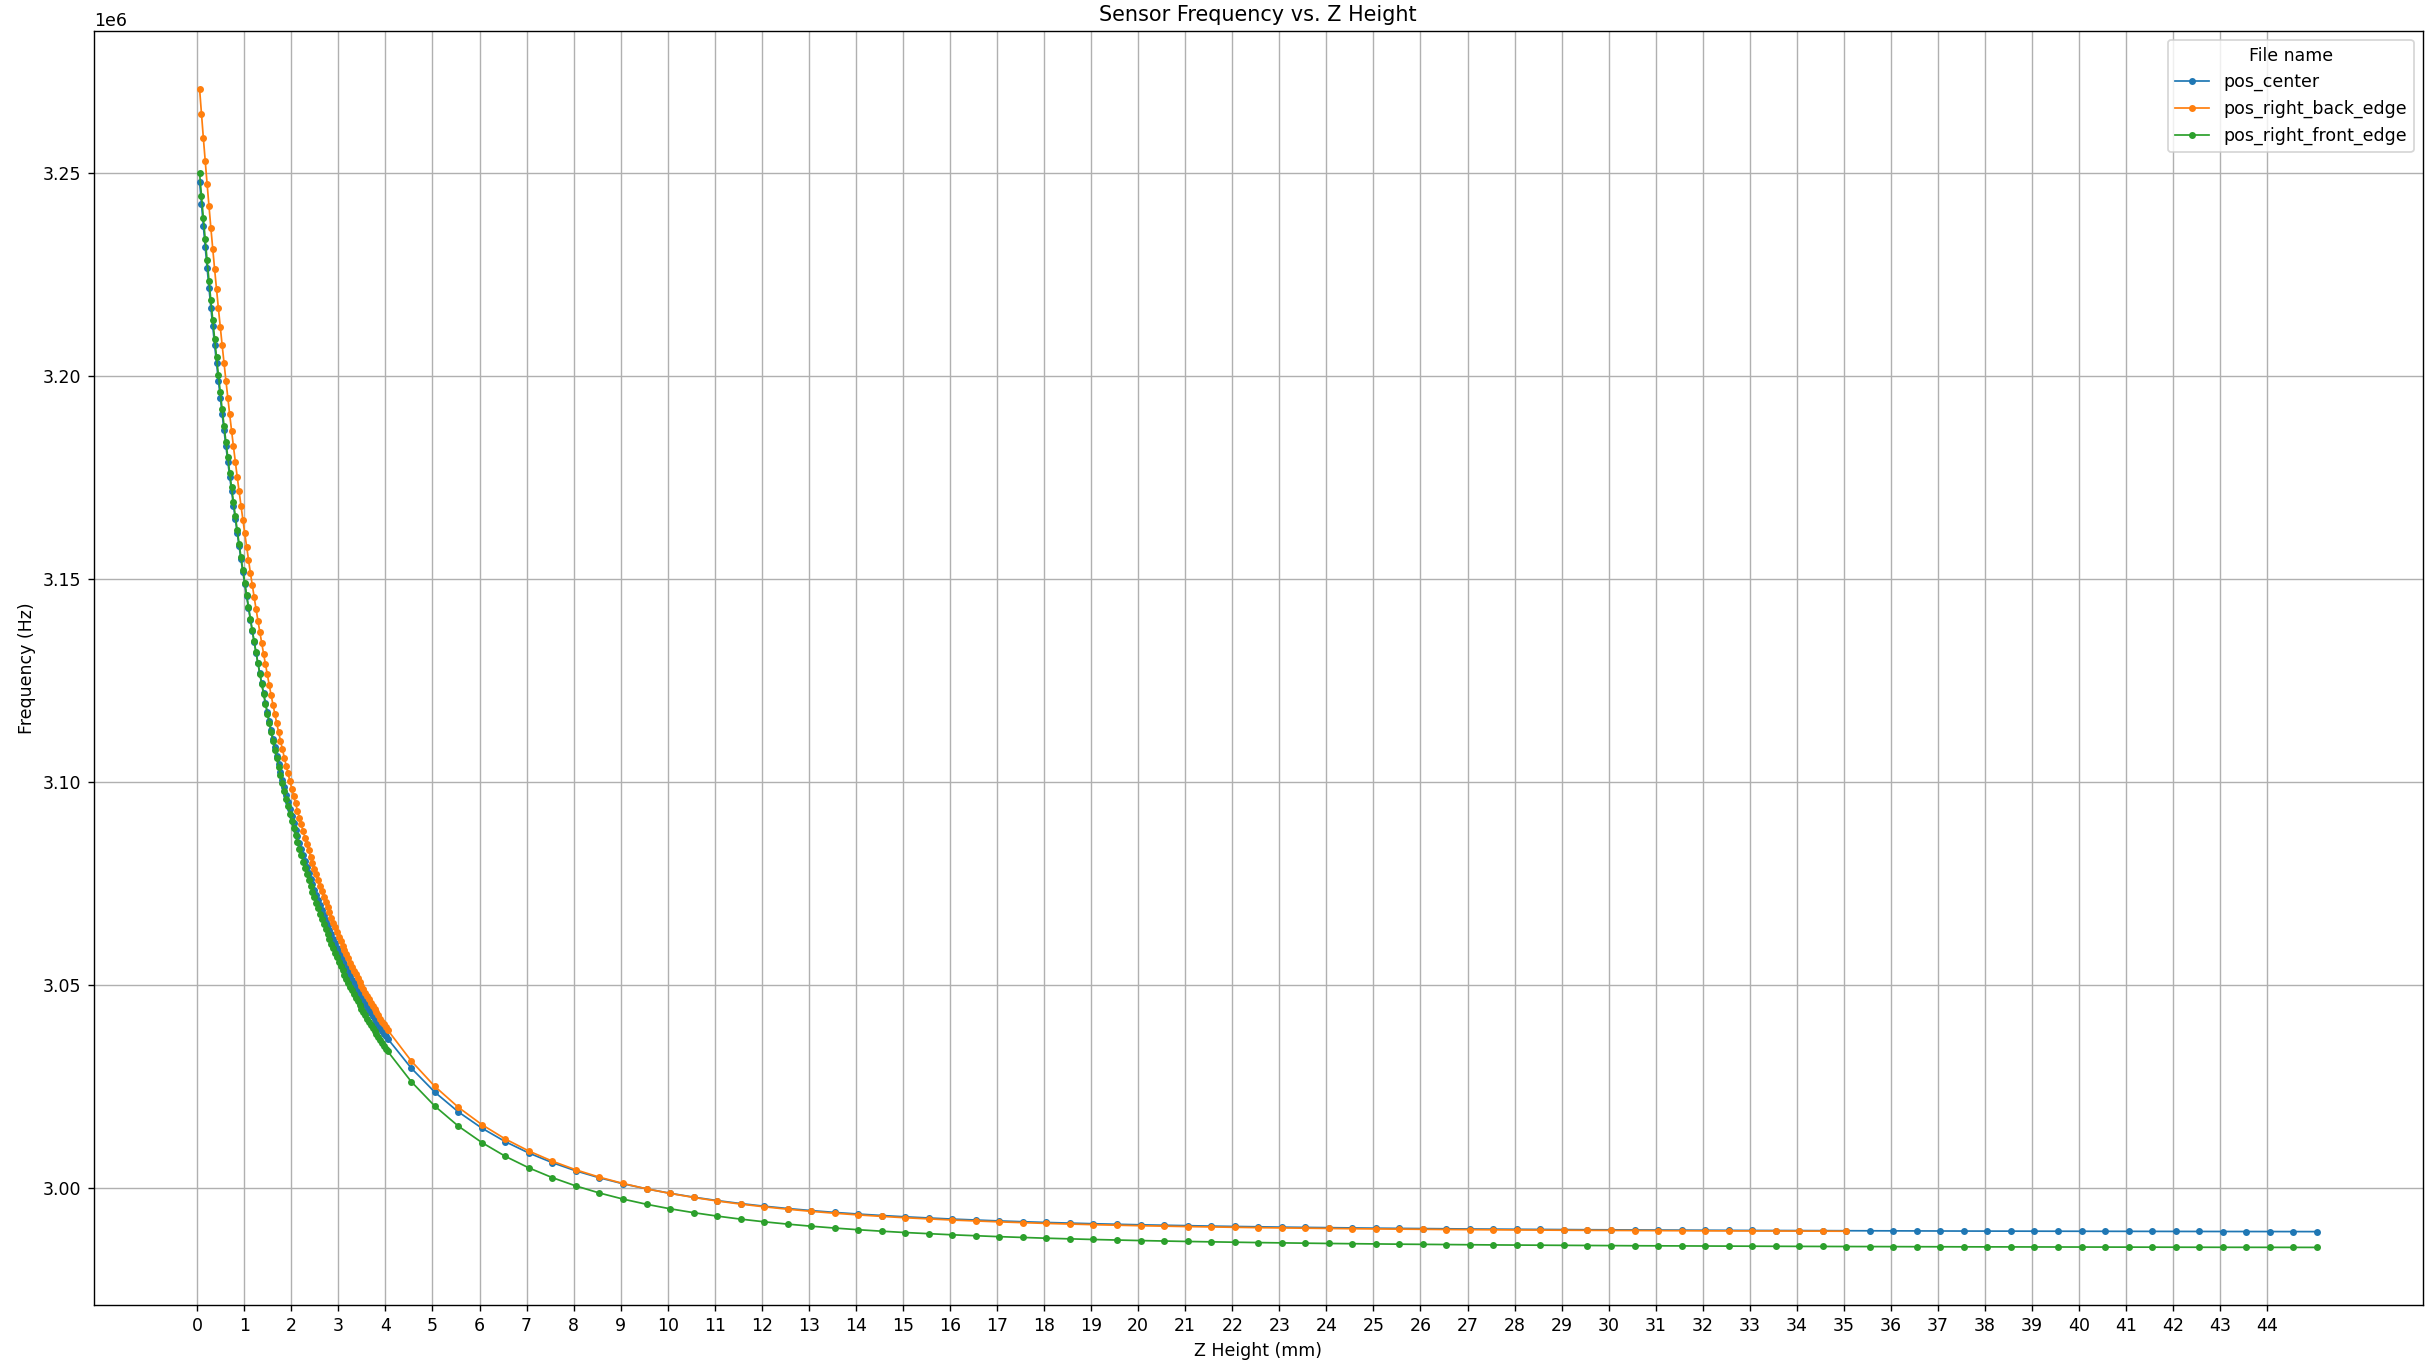
Let’s look at some real data, from real BTT Eddy sensors:

The points are the data from the
PROBE_EDDY_CURRENT_CALIBRATE, calibration was patched to get more points past 4 mm.The more the frequency distance between Z points, the better and more stable the resolution we have. Simply because of finite resolution and frequency, it should give a better signal-to-noise ratio overall.
2 lines are from one user with the Naked Eddy board.
They are important because they are as close as it can get to what it should be.
Our default 4 mm is mapped over the sensitive region of the asymptotic function.
You can see the datapoints with the naked eye and count them, even guess the frequency difference. The sensor does the same. It can easily measure the large difference in frequency even if it is noisy, not stable .
If there is a temperature drift of the coil, the drift is ppm/K, or simply speaking -10 Hz/K (just a random number to show the idea).
For the steep part of the data, it is less a great deal, there are thousands of hertz range between points 0.04mm and 0.08mm.
But if we place the sensor too far away, the data goes to the more flattish region.
(Look at the signal form of the other lines). This exact drift would cause a major shift in the output frequency. Simply because now we have … hundred or two of hertz?
You can try to plot your data with the script from the carto topic.
So, simply speaking from a resolution perspective, purple and red lines are as good as Eddy can get. Orange is better than the green and blue (steeper), and green and blue should perform mostly the same.
(Again, we really care about delta frequency/ delta distance).
It is possible to decrease the z_offset, so homing/probing would be in a slightly more sensitive region. You can even check the difference between values in your config, your calibration data is the data above Z:Frequency, Z1:Frequency1 & etc
There should be something about current and amplitude, but honestly speaking, I’m a little bit unsure. Application manual about drive current: https://www.ti.com/lit/an/snoa950/snoa950.pdf
We do experience “Eddy current sensor error” issues when the amplitude goes above or below thresholds.
The current calibration routine ensures that we never go above 1.8V. So, we can perform homing from an infinite distance. But it does create issues because at a closer distance (lower Z offset) or with higher temps, we can go below 1.2v, and again get the same error.
Because now I think that it is better to use a closer sensor range, and because there are dependent amplitude errors from the sensor.
Taking into account our occasional use of the sensor, it seems that it is possible to overdrive the current by +1 on average (or just calibrate the current with the bed closer to the sensor, it does the same thing), and then simply disable the amplitude error on the MCU side.
About all of the errors: https://www.ti.com/lit/an/snoa959/snoa959.pdf
Probably amplitude error checking could help if the capacitor is lost (as a result of a collision, for example).
Maybe a more sophisticated solution is required.
Homing, probing issues.
The current Klipper homing routine is pretty simple: stream frequency data from the sensor, move the bed, stop moving the bed when the frequency > threshold.
Where the threshold is z_offset, it is converted to the appropriate calibrated frequency.
When it triggers, then Z now is equal to the z_offset.
That is it.
Probing does additional data processing after the trigger, to get the sensor output when the bed is stable.
Now, taking into account the above data about sensor resolution distribution, it would not be stable as long as the sensor is too far away.
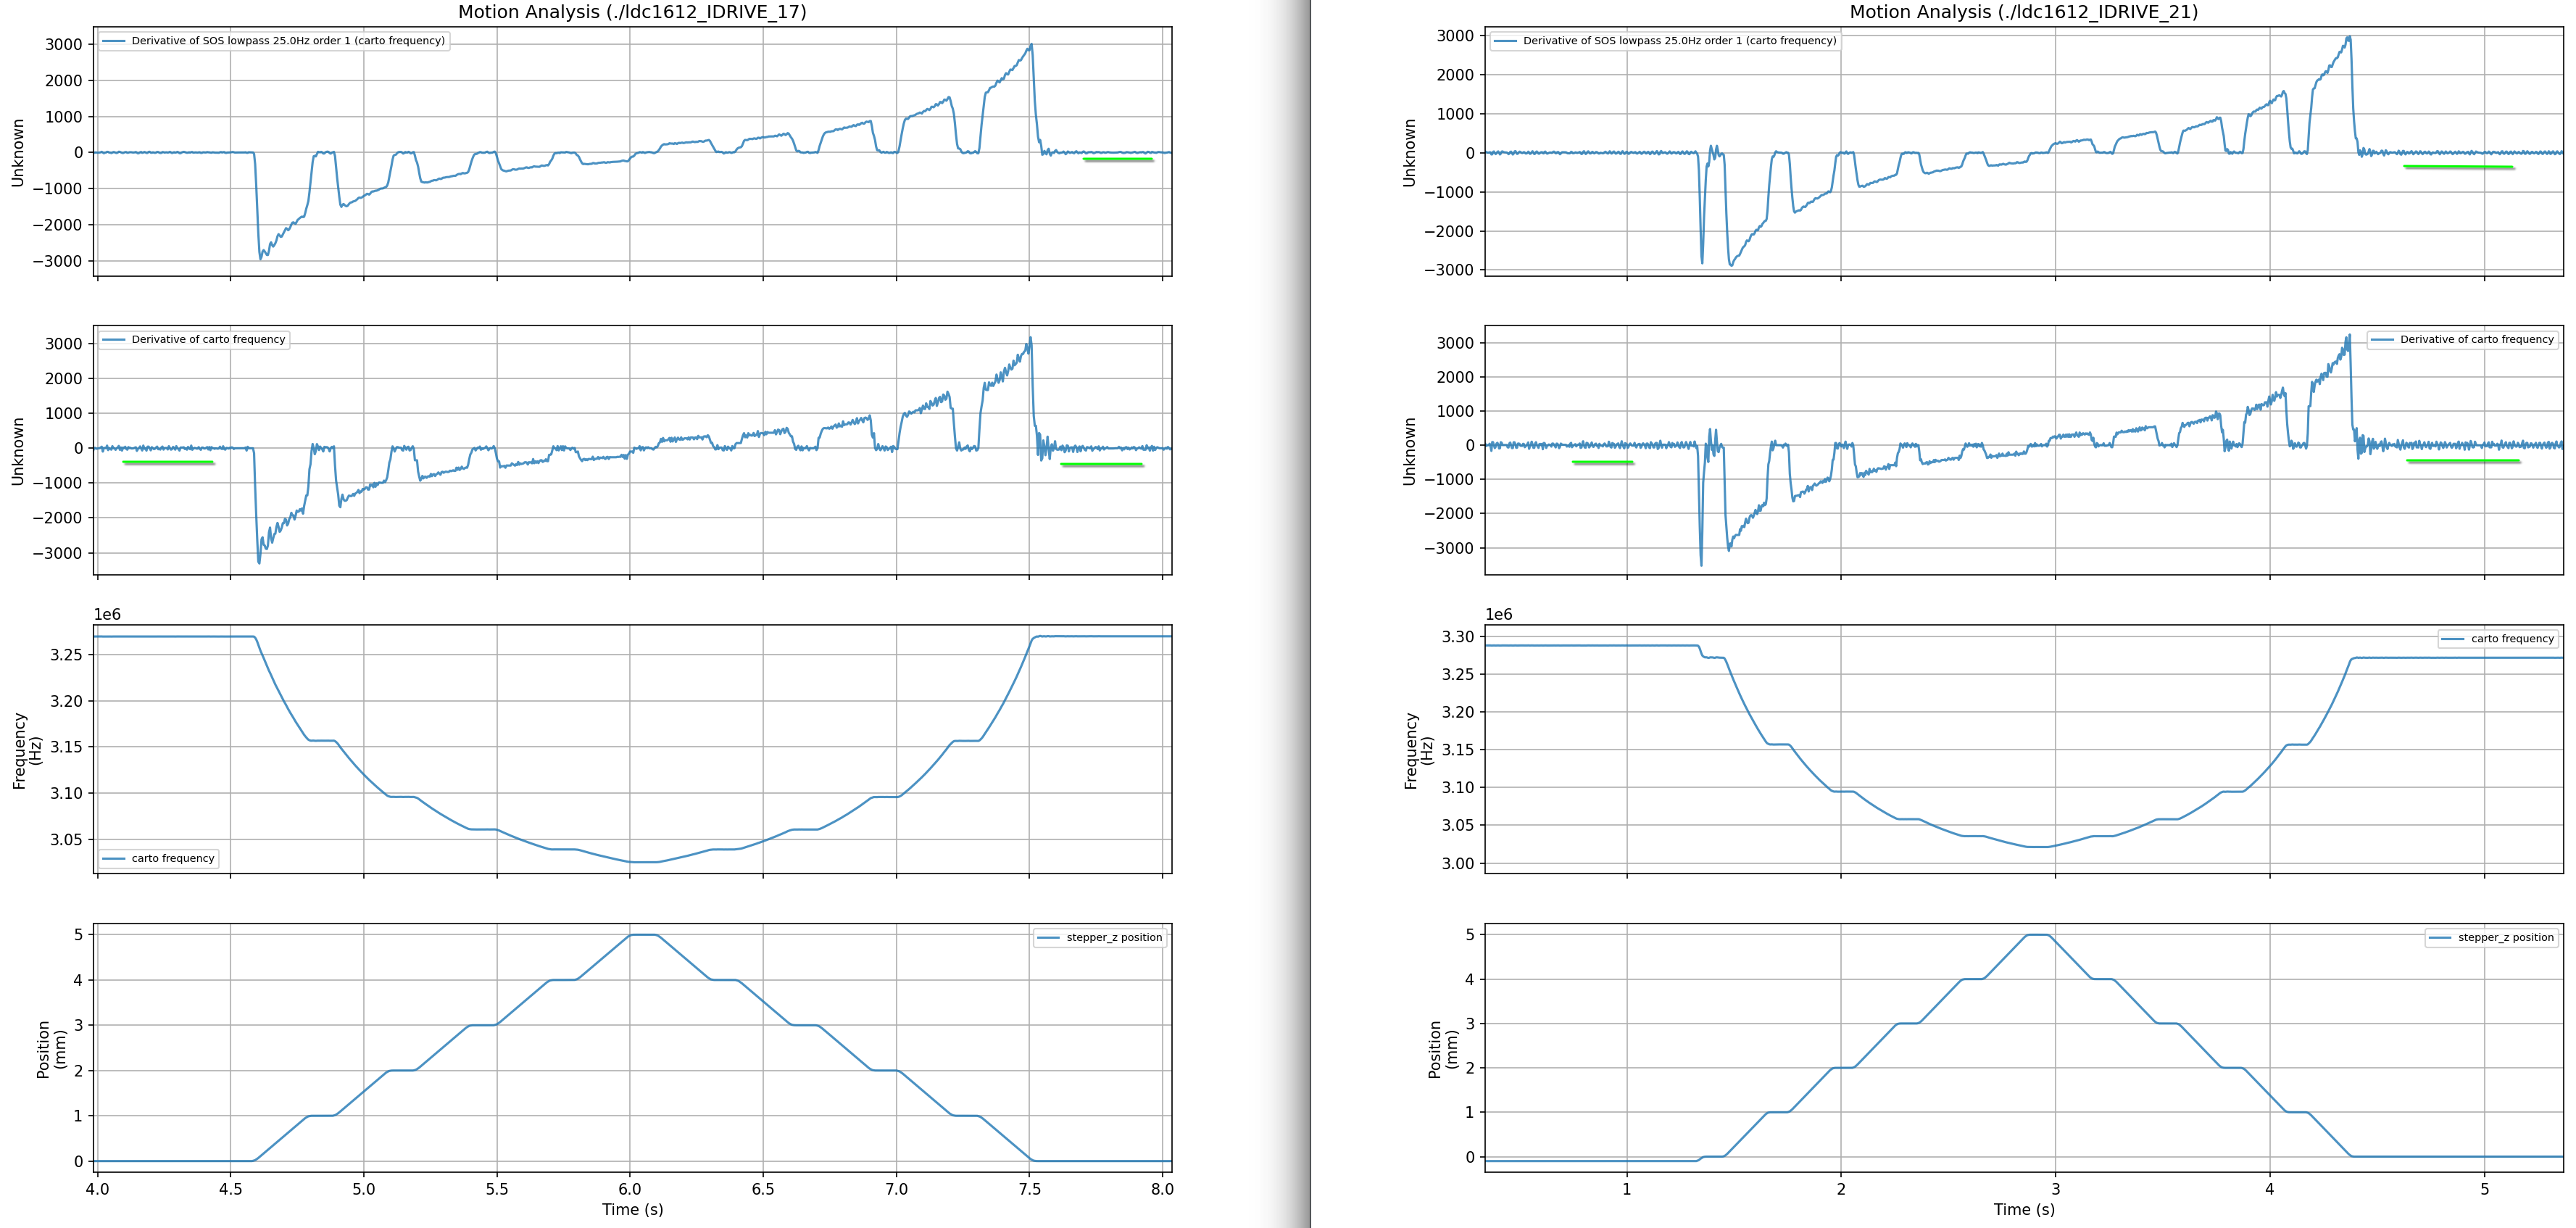
Let’s take a look at the homing data from the people above:

(They are both pretty noisy).
- Derivative of frequency (delta frequency over delta time, but time = 1) over filtered data.
- Derivative of frequency over raw frequency data.
- Raw frequency data.
- Z distance
Derivative is used here for demonstration, to make frequency spikes much more obvious.
There are spikes around the start/end of the motion, but generally, there is one from the supergun (~2mm), where the sensor is a little bit closer, a little bit less noisy than the right one, where the sensor has a higher distance (~3mm + 1mm of eddy plastic case, I guess).
Even before and after the filtering.
There is a branch with the MCU side SOS filter for homing: https://github.com/nefelim4ag/klipper/tree/ldc1612-homing-sos-filter
It should just work, and require MCU flashing to get it to work. To revert, you can revert only the host side, it should affect nothing without host initialization.
Then there is a probe offset.
From my humble experience with a pretty stable output of the carto board.
You can test the homing consistency with the following snippet:
G28 Z
M400
GET_POSITION
// mcu: stepper_x:20 stepper_y:42 stepper_z:4453 stepper_z1:4453
Run it several times, and what we are interested in is what the distribution looks like.
In my case, the max value in steps would be like 4461, and the minimum would be 4450.
Then, I know my rotational distance and motor steps, so:
4 / 200 / 32 * 21 = 0.0131 mm
What sounds okayish to me.
(SOS filter does nothing for me).
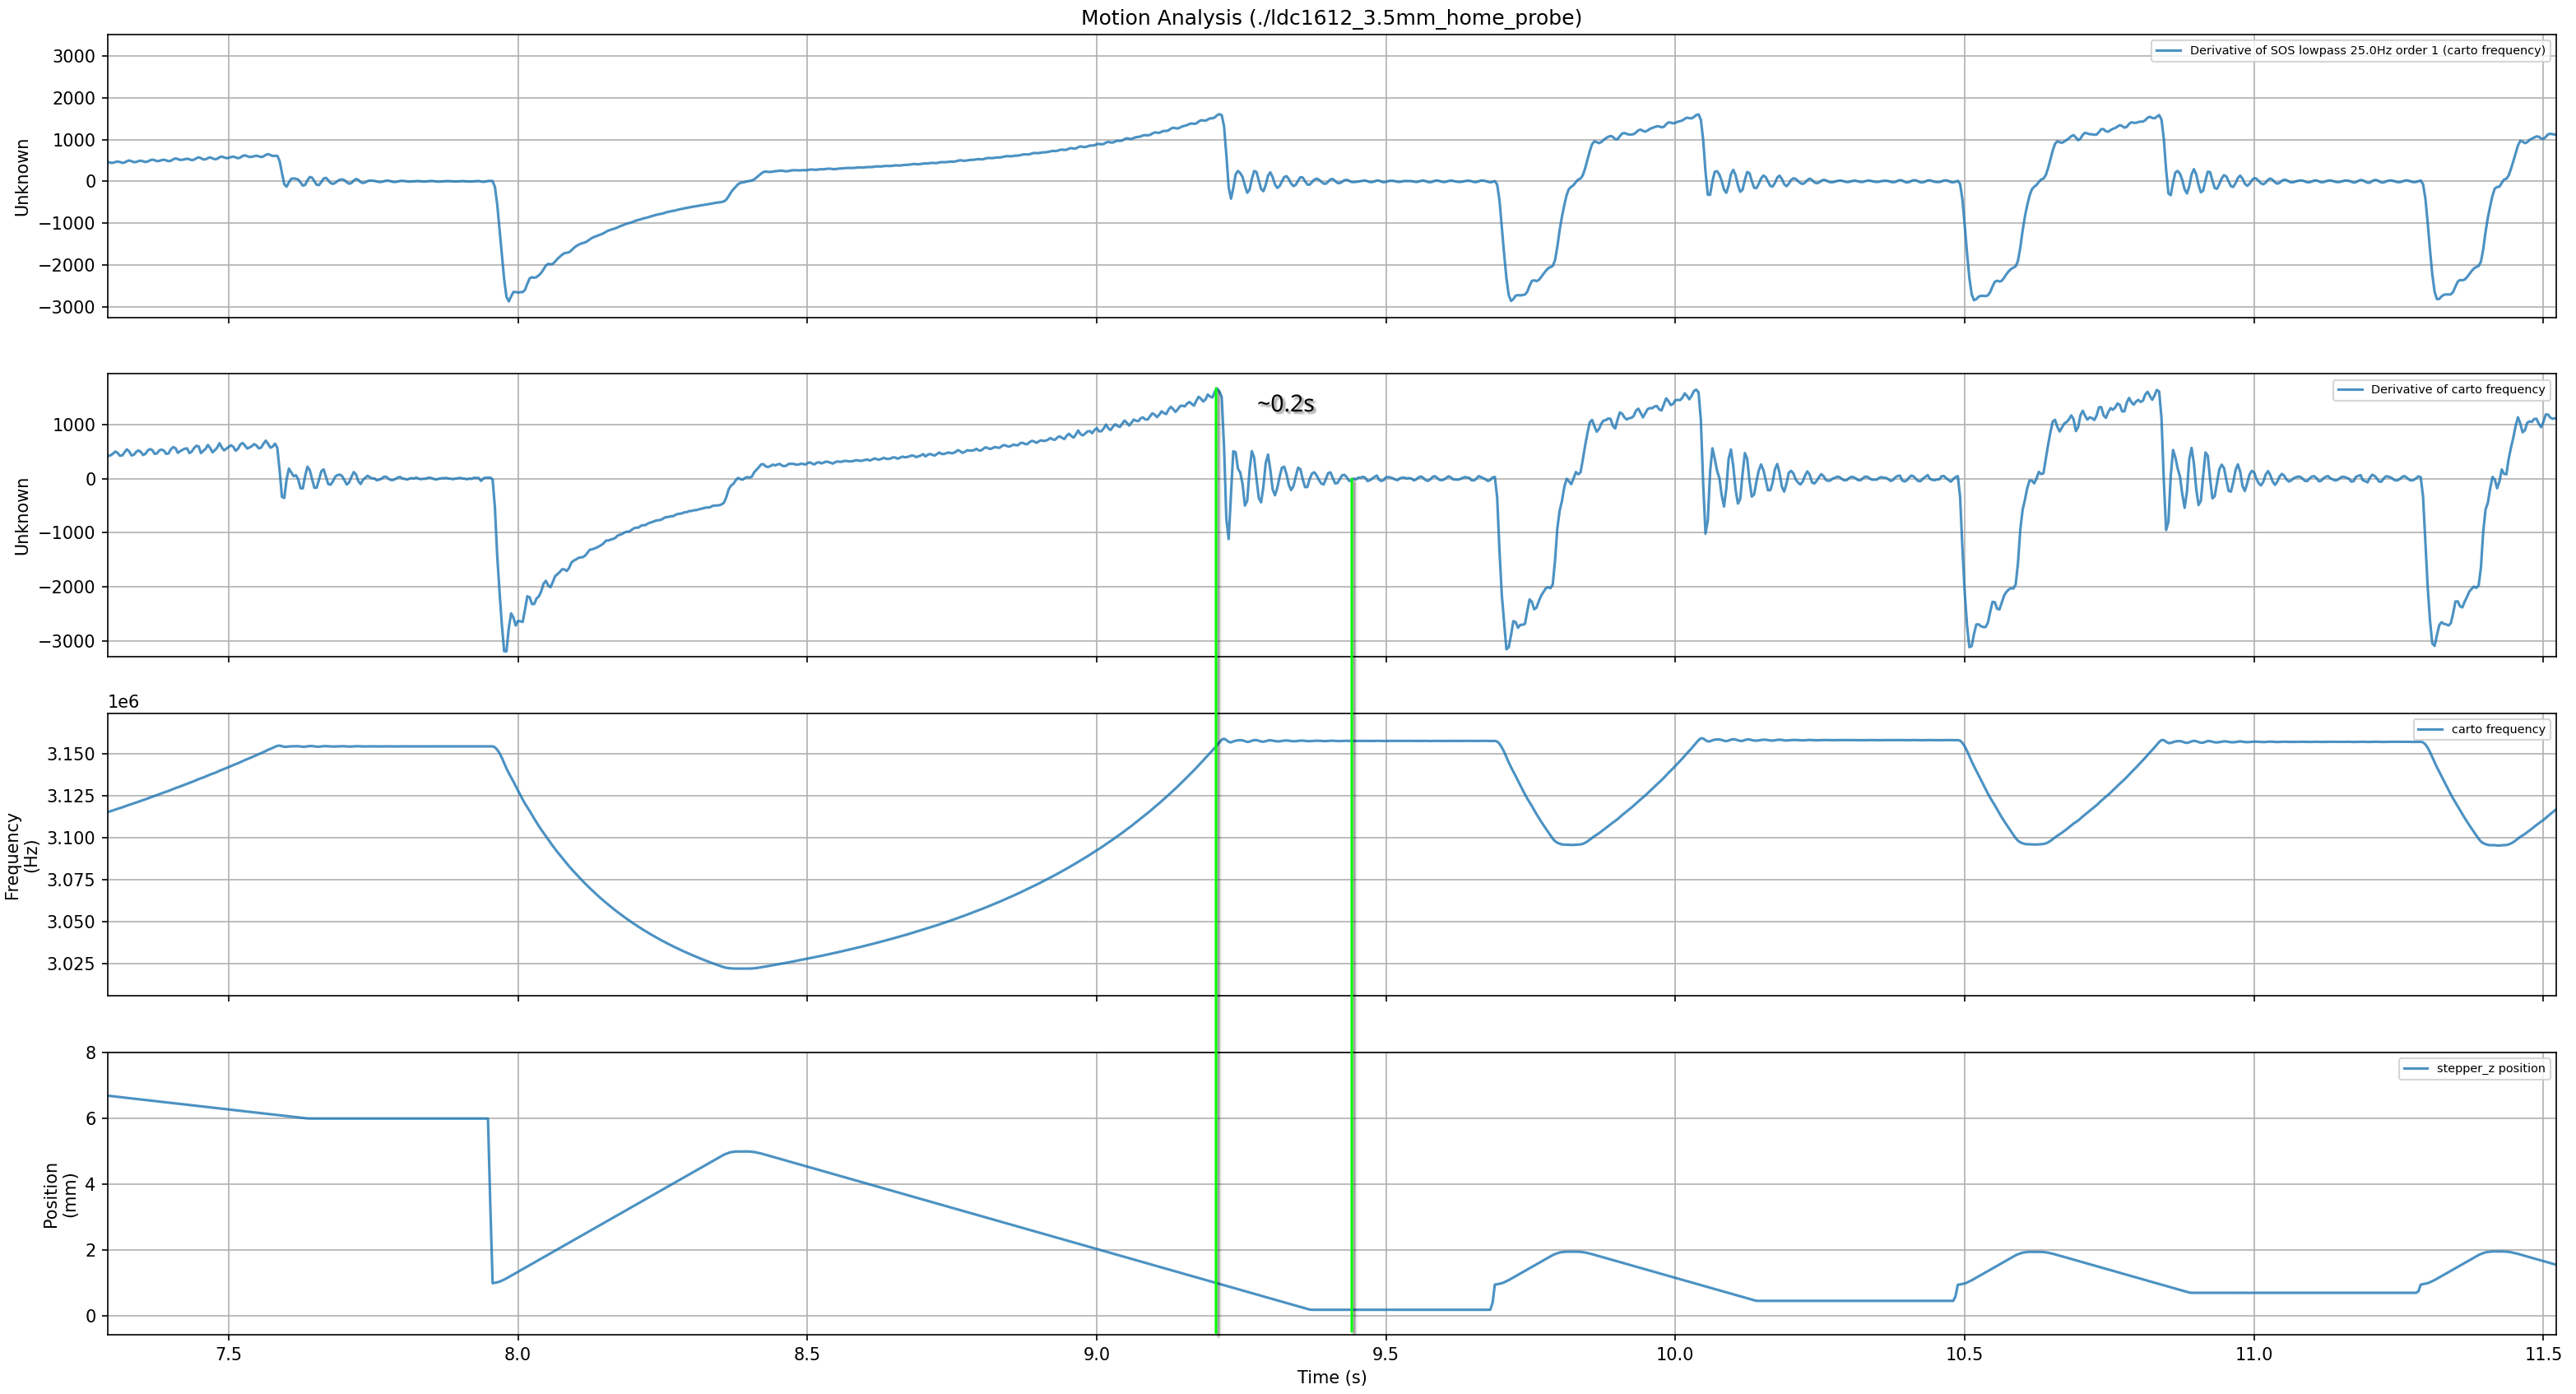
Then there is the probe offset. We request data from the LDC1612 at 250Hz.
Then there is the I2C speed.
So, I can estimate the lag for I2C: 5 * 2 * 9 / 400_000 = 0.000225 s
And for the homing move: 1 / 250 = 0.004 s
So, total lag would be: 0.004225 s
2 mm/s * 0.004225 = 0.008 mm
5 mm/s * 0.004225 = 0.021 mm
10 mm/s * 0.004225 = 0.042 mm
And for me, this is close to what I experience, not precise, but pretty close.
(I guess there is a moving bed, which distorts signals a little, and also sample time inconsistencies between runs, we can guarantee that sample N always happens at position/time p/t).
If you do have the stable frequency output and more or less stable homing, you can easily verify it by adjusting:
[stepper_z]
...
homing_speed: 10
second_homing_speed: 2
Second homing speed gives me:
// probe accuracy results: maximum 3.019506, minimum 3.018543, range 0.000963, average 3.018949, median 3.018928, standard deviation 0.000292
So, there is a 0.02mm difference between the homing and the probe.
If I try to decrease the homing speed and secondary speed to 4 and 1, it gives me 0.01mm difference.
Hope that information can be helpful.
Thanks.

Ref: https://www.ti.com/lit/an/snoa930c/snoa930c.pdf
Well, it should be close to the nozzle by the Z axis.
That is it.
Script allows to live dump values from the Btt Eddy, which can help understand the noise and how frequency behaves, depending on the object distance (or other settings in the config, like current).
Script.py
#!/usr/bin/env python3

import json
import socket
import statistics
# May require: apt install python3-websocket
from websocket import create_connection

# btt_eddy is the name from the config [probe_eddy_current btt_eddy]
ws = create_connection("ws://localhost:7125/klippysocket")
ws.send(json.dumps({"id": "1", "method": "ldc1612/dump_ldc1612", "params": {"sensor": "btt_eddy"}}))

freqs = []
while True:
    params = json.loads(ws.recv()).get("params")
    if params:
        d = params["data"]
        for row in d:
            freqs.append(row[1])

        if len(freqs) > 100:
            mean_freq = statistics.mean(freqs)
            stddev_freq = statistics.stdev(freqs)
            freqs = []

            print(f"Mean frequency: {mean_freq:.3f}, StdDev: {stddev_freq:.3f}")
        # for l in d:
        #     print(f"{l[0]},{l[1]},{l[2]}")
$ python3 ~/printer_data/config/dump.py
Mean frequency: 3260699.726, StdDev: 54.374
Mean frequency: 3260709.724, StdDev: 56.101
Mean frequency: 3260710.413, StdDev: 61.310
Mean frequency: 3260712.727, StdDev: 57.472
Mean frequency: 3260708.085, StdDev: 65.497
Mean frequency: 3260703.406, StdDev: 57.057
Mean frequency: 3260710.348, StdDev: 58.397
...
Saving this for later.