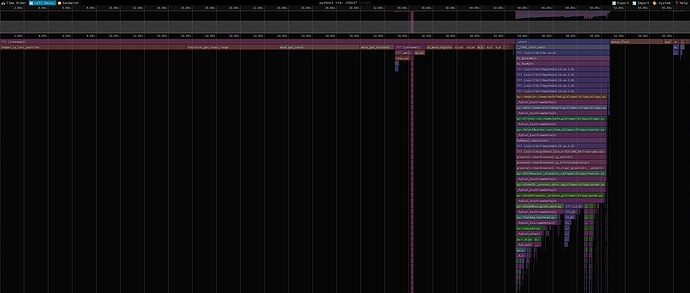
Well, the “problem”. The itersolver can take a significant CPU time.
This would really depend on the specific printer config/speed/slicer precision.
How do I profile the code (python >= 3.12):
$ export PYTHONPERFSUPPORT=1
$ time perf record -F 9999 -g -- python3 -X perf klippy/klippy.py rp2040_printer.cfg -i short.gcode -d out/klipper.dict -o test.serial -v
$ perf script > out.perf
How do I view the output: speedscope
I tested with arc fitting disabled, with the example model:
It takes ~57s:
With patched InputShaper, it takes ~49s.
49/57 = 0.859 ~ 14%
What’s the patch?
It does cache the input shaper intermediate position between calls.
I don’t think it is a clever solution. It is just what I can come up with.
With chelper -O0, not patched:
So, from my previous investigations.
Basically, the itersolver could do multiple tries around the same move, and if there are too many small moves to travel, they are multiplied by each other.
Like 100 tries, 100 moves ~10000k iterations.
(Actually, more tries, fewer moves, but it shows the idea).
Arcs can also produce small moves, generally.
Which could also make a high pressure there.
So, I’m not sure how stable the patch is; it does pass the tests.
It does work faster on average (I did try the different models).
PA range integrate could also use a significant time, but now I do not think there is an easy fix.
Thanks.
I already mentioned this overhead here: Klipper: communication bus tests - #11 by nefelim4ag
I agree that arcs are bad test cases, so I cleaned the patches and tested on something more “general”.


