Delay in receiving accelerometer data

At the moment I am writing a program that collects accelerometer readings from certain kinematic movements. The movements are quite short, and after each of them I should receive measured information from the accelerometer. During the end of a movement, which lasts for example 1000ms, at least 300+ ms passes before I get the timing I need for the end of the movement in the accelerometer samples. I tried to figure out the reason for these delays, but could not reduce them in any way. In my opinion the worst case delay should be equal to BATCH_UPDATES which is 100ms by default.

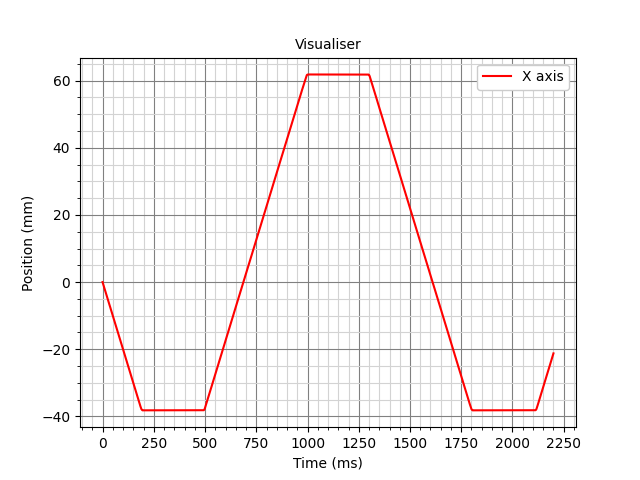
I wrote a small extra that simulates this defect. It moves the print head 10 → 50mm on X, and at each turn it waits for the measurements to arrive from the accelerometer.
You can add it to your extra and specify it in the configuration:

[accel_timing_test]
accel_chip: adxl345

The program shows the planned start and end timings of the movement, which is also the measurement timings:

/ measure_start_time: 18.1151011475
  measure_end_time: 18.61908726

In “real time”, shows callbacks of accelerometer data in handle_batch(), comparing actual print_time with the last sample_mcu_time from batch:

// print_time: 18.61908726, sample_mcu_time: 17.941941, delta: 0.6771462600000007
// print_time: 18.61908726, sample_mcu_time: 18.043266, delta: 0.5758212600000014
// print_time: 18.61908726, sample_mcu_time: 18.141421, delta: 0.47766625999999945 
// print_time: 18.61908726, sample_mcu_time: 18.242744, delta: 0.3763432600000023
// print_time: 18.61908726, sample_mcu_time: 18.344068, delta: 0.27501926000000054
// print_time: 18.769216634652995, sample_mcu_time: 18.442217, delta: 0.32699963465299575
// print_time: 18.80201592, sample_mcu_time: 18.543531, delta: 0.25848491999999723
// print_time: 18.9030213425, sample_mcu_time: 18.644842, delta: 0.2581793425000001

In principle, I use a self-written handle_batch() only because it displays additional information.

And shows final the line:

// now_print_time: 18.9077851925, last_mcu_time_in_batch: 18.644842, delta: 0.26294319249999987, get_sample_delta: 0.28869793249999987

Where
now_print_time - current print time
last_mcu_time_in_batch - The time of the last measurement in the incoming batch, which exceeded measure_end_time, which allowed us to complete the wait for data from the accelerometer.
delta - comparison now_print_time with last_mcu_time_in_batch
get_sample_delta - comparison now_print_time with measure_end_time, the full time from the end of move and receiving data.

I also consulted @nefelim4ag about this problem, but we did not come to any conclusion, and I decided to ask this question here.

Any edits and suggestions. Thanks.

1 Like

This isn’t a “defect”, I’d call it a design choice. Data from bulk sensors is collected and batched on the MCU and sent back to the host at intervals, usually once a full packet could be sent. This makes best use of the serial bus bandwidth (USB packets have a fixed size). Then a thread in the host receives these updates and batches them up for processing. There is a tradeoff with the overhead of processing the batch and the batch size. Larger batches are more cpu efficient.

If the application requires the sensor data for processing before the next movement you have to wait for that data to arrive. It sounds like you have that process solved correctly, by looking at the print time of the samples you get back.

If you application allows you can mask the delay by doing additional movements while the data streams back.

E.g. in the load cell project I have 2 similar wait times. One for tearing the load cell before a probing move, for that one I have no alternatives, the toolhead has to be stationary. After the probing move is complete there is a similar wait. For that one we are looking at doing the retract move while the data is gathered and processed. This would “hide” the collection and processing time from the user.

This is an incredibly common UX idea in general. E.g. on the web we often show the results of an action before the service call returns, we just assume it will complete successfully. Instant gratification is almost always a lie.

You are right, but I think the main question here is where it comes from, and I can’t answer this question.

From my rough calculations:
adxl345 use rate 3200 ~ 3200 Hz, 5 bytes per sample.
Bulk code stores up to 51 bytes, when it is full they are transferred to the host.
51 // 5 = 10 samples.
3200 // 10 = 320 reports per second.
Max latency here is fixed ~ 1 / 320 = 0.003 s = 3 ms
Then there is a transfer to host, with USB speed of 1.5mbit, theoretically something around 64 * 8 / 1_500_000 = 0.00034 s = 0.34 ms
Let’s assume there is processing overhead and other messages, like 2ms.
We have 5 ms in total, till the message arrives to the host.

A thread pulls serial data and safe them in BulkDataQueue.
It is wrapped by FixedFreqReader, which is used in accelerometers and load cell code (and does not in angle sensors BTW).

ADXL defines FFReader with bulk_report 0.1 seconds.
Looks like in the worst case, data arrive at the same time when we are processing data,
and, we will have them in the next processing window in ~0.1s

If the reactor is free and able to do timers in time, we should see data with latency ~100ms + 5ms.

I can miss something, but I have no idea where that latency (x2 or more) comes from.

I looked at your code a bit. Time is tricky because klipper schedules things to run in the future.

I’m suspicious of this: klippy-modules/accel_timing_test.py at 09558c7d8d943bf212937adde37247cd954f34f3 · MRX8024/klippy-modules · GitHub
That’s the end time of the previous move, not the time when the move you are about to execute will start. Your loop blocks, so that time will include all the waiting you do on the previous run and it shouldn’t. You need to look at how run_script_from_command is going to schedule your move to be run. The moves are all a fixed size so they should take an exact fixed amount of time to run because that’s how the motion planner works. If you don’t get a fixed delta you are counting other time that’s not part of the move.

Also print_time in your code is really toolhead.get_last_move_time(). So that name is misleading. It is a fixed time (usually in the future!) when the last planned move will end. So that’s why the delta is decreasing in your data, the present time is getting closer to the future and the delta is getting smaller. If you want to know how late a batch is, you should get the print time from the reactor. I think you want something more like:

now = reactor.monotonic()
print_time = mcu.estimated_print_time(now)

It would also be nice to know the number of batches that are reported after the true print_time passes request_end_time. I’d assume that number should be be 1, 2 or possibly 3. 1 if you get lucky, 2 if you get unlucky and 3 if something else is delaying things. Each batch costs 100ms so I’d assume the spread of this process is from ~50ms to ~300ms. And I’d guess that the average is 150ms.

Well, my program does not allow you to hide the time spent waiting for samples, like yours, unfortunately.

However, no, this time also flies, and with a new movement I get a different time, for example -

/ measure_start_time: 129.1822845475
  measure_end_time: 129.6854379275

and immediately the next measurement

/ measure_start_time: 129.999242425
  measure_end_time: 130.50315486

The difference between the previous end of the movement and the new one is ~314ms in this case. But even if it’s not accurate, in principle this is not particularly important to us, is it? We count the time from the end of the movement until the samples arrive.

I add this in handle_batch() and this time is indeed almost synchronized with the samples time (signed as mcu_time), for example -

// measure_start_time: 129.1822845475
// measure_end_time: 129.6854379275 
// print_time: 129.6854379275, mcu_time: 129.02971465, sample_mcu_time: 129.02217,
// print_time: 129.6854379275, mcu_time: 129.12963911, sample_mcu_time: 129.120229,
// print_time: 129.6854379275, mcu_time: 129.23053475, sample_mcu_time: 129.221469, 
// print_time: 129.6854379275, mcu_time: 129.33118413, sample_mcu_time: 129.322702,
// print_time: 129.6854379275, mcu_time: 129.43189727, sample_mcu_time: 129.423934,
// print_time: 129.8399876596, mcu_time: 129.53282417, sample_mcu_time: 129.522, 
// print_time: 129.8828060875, mcu_time: 129.63289726, sample_mcu_time: 129.623222,
// print_time: 129.9920403275, mcu_time: 129.74216888, sample_mcu_time: 129.724449,
// now_print_time: 129.994387245, last_mcu_time_in_batch: 129.724449, get_sample_delta: 0.30894931750000865

But in this case, if mcu batches arrive quickly, where does this delay actually appear?

I don’t really understand what we’re talking about here. I expect samples by checking request_end_time against the last time from the sample received in the batch, not the “incorrect” toolhead.get_last_move_time().
If this is considered the correct time after which I set the False flag so that no more batches are collected, then at the moment I get 1 extra batch (last str), for example -

// measure_start_time: 2211.3274537725
// measure_end_time: 2211.830420705
// print_time: 2211.8304207050, mcu_time: 2211.1739369500 sample_mcu_time: 2211.1656420000,
// print_time: 2211.8304207050, mcu_time: 2211.2741783675 sample_mcu_time: 2211.2638140000,
// print_time: 2211.8304207050, mcu_time: 2211.3739744175 sample_mcu_time: 2211.3651700000,
// print_time: 2211.8304207050, mcu_time: 2211.4752768575 sample_mcu_time: 2211.4665120000,
// print_time: 2211.8304207050, mcu_time: 2211.5763287900 sample_mcu_time: 2211.5678580000,
// print_time: 2211.9839797747, mcu_time: 2211.6755579050 sample_mcu_time: 2211.6660340000,
// print_time: 2212.0257664725, mcu_time: 2211.7758653925 sample_mcu_time: 2211.7673690000,
// print_time: 2212.1268591125, mcu_time: 2211.8769601975 sample_mcu_time: 2211.8687030000,
// now_print_time: 2212.1283742075, last_mcu_time_in_batch: 2211.868703, delta: 0.2596712075001051, get_sample_delta: 0.2979535025001496 
// print_time: 2212.2276368650, mcu_time: 2211.9777190350 sample_mcu_time: 2211.9668710000,

In general, the only thing that separates the movements is the wait until the desired sample is obtained. The other day I installed encoders on my printer, we can use them to validate the real delay between movements, no matter how funny it may sound.
The approximate range of motion iterations -

Actually, the delay converges, about ~300ms.
Thanks for your time, do you have any ideas on what else might be worth trying?

Hmmm.
Answering the original question.

INFO:root:pull_samples: raw_samples latency: 155.847us
INFO:root:lis2dw:_process_batch:convert samples latency: 370.844us
INFO:root:_proc_batch latency 399.206us
INFO:root:AccelQueryHelper:handle_batch latency 421.808us

INFO:root:pull_samples: raw_samples latency: 183.398us
INFO:root:lis2dw:_process_batch:convert samples latency: 344.094us
INFO:root:_proc_batch latency 362.759us
INFO:root:AccelQueryHelper:handle_batch latency 376.404us

INFO:root:pull_samples: raw_samples latency: 20095.29us
INFO:root:lis2dw:_process_batch:convert samples latency: 20261.456us
INFO:root:_proc_batch latency 20281.363us
INFO:root:AccelQueryHelper:handle_batch latency 20294.838us

INFO:root:pull_samples: raw_samples latency: 19981.419us
INFO:root:lis2dw:_process_batch:convert samples latency: 20167.402us
INFO:root:_proc_batch latency 20191.818us
INFO:root:AccelQueryHelper:handle_batch latency 20211.183us

patch.txt (4.7 KB)

This is done on the desktop machine with SHT36v3 and lis2dw.

So, inside the Python code, the data is traveling within ~1ms.
Assuming there is no other load that would block the reactor for a prolonged time.

Data rate is 1600, 6 bytes per sample, 51 bytes per bulk message.
51 // 6 = 8 samples per message.
1600 / 8 = 200 messages per second.
1 / 200 = 0.005ms per message.

20ms is the artifact of the batch update time, thread wake-up time, and reactor internal sleep.
It can be decreased, for example, BATCH_TIME 100ms->20ms.

INFO:root:pull_samples: raw_samples latency: 14320.246us
INFO:root:lis2dw:_process_batch:convert samples latency: 14422.969us
INFO:root:_proc_batch latency 14437.827us
INFO:root:AccelQueryHelper:handle_batch latency 14449.319us

INFO:root:pull_samples: raw_samples latency: 14617.625us
INFO:root:lis2dw:_process_batch:convert samples latency: 14723.174us
INFO:root:_proc_batch latency 14739.354us
INFO:root:AccelQueryHelper:handle_batch latency 14752.809us

Then, the sleep lag could also be compensated:
<deleted section, there is no pause() or time.sleep() there>

I think the 100..300ms latency is not the actual data latency.
It is the latency between scheduling the move and getting the accelerometer data about this move.

If you measure the time between the scheduled movement and the data about it, it would be ~300ms. Simply because Klipper does not perform real-time movements, except for the drip move, which is closer to real-time.

Hope that explains something.


By the way, it is an interesting question, why there is 10ms between the last appending of raw samples from the serialhdl thread, and the actual read.

If I try to set the: BATCH_UPDATES = 0.010
It often returns no data.

INFO:root:lis2dw:_process_batch:convert samples latency: 13728.902us
INFO:root:_proc_batch latency 0.0us
INFO:root:pull_samples: raw_samples latency: 3911.382us
INFO:root:lis2dw:_process_batch:convert samples latency: 3962.598us
INFO:root:_proc_batch latency 3975.813us
INFO:root:AccelQueryHelper:handle_batch latency 3987.495us

INFO:root:lis2dw:_process_batch:convert samples latency: 14259.663us
INFO:root:_proc_batch latency 0.0us
INFO:root:pull_samples: raw_samples latency: 4377.409us
INFO:root:lis2dw:_process_batch:convert samples latency: 4437.473us
INFO:root:_proc_batch latency 4456.729us
INFO:root:AccelQueryHelper:handle_batch latency 4468.371us

But latency does decrease.