I have published a complete rewrite of the Klipper log graphing tool:
- Updated parser to hopefully now catch all edge cases that had been causing weird jumps in the timeline.
- Improved session management.
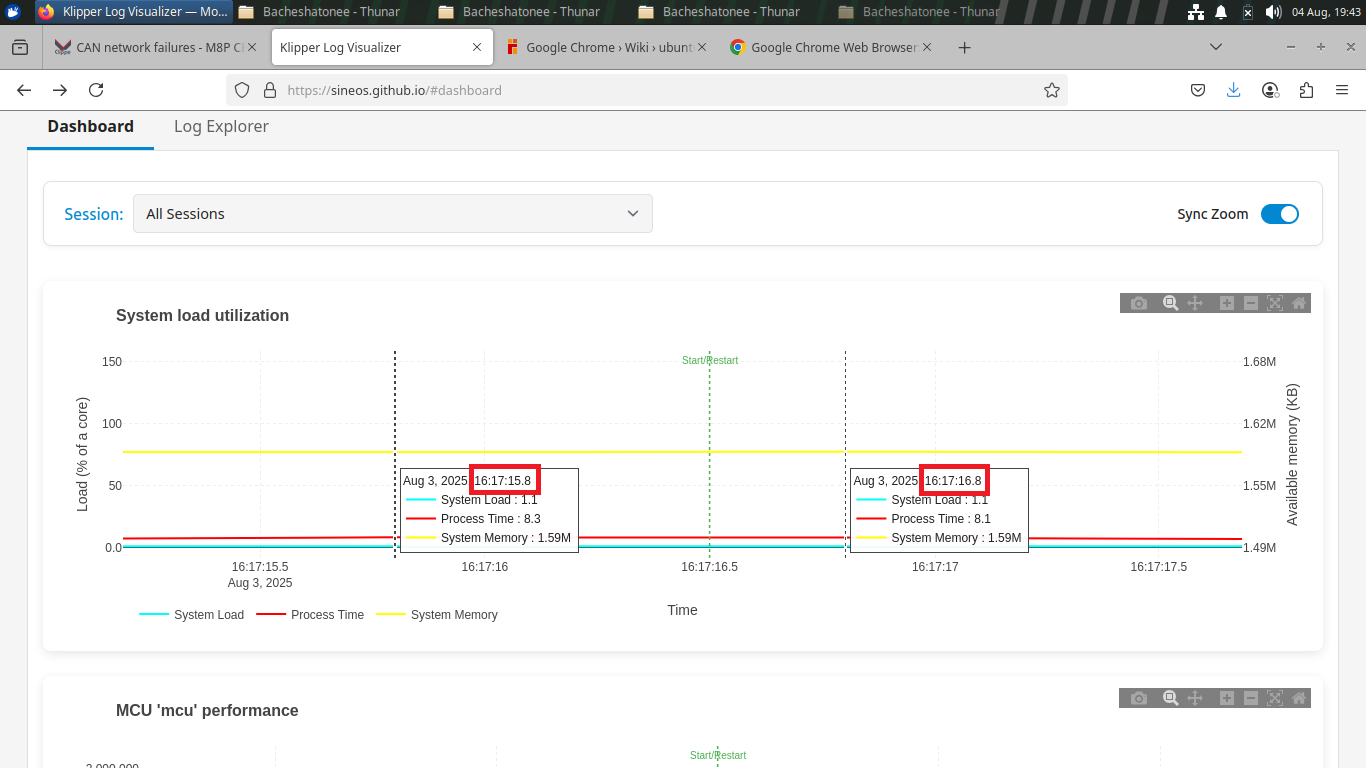
- Synchronized Zoom – this means when one graph is zoomed, all other graphs will follow. Note: On big logs this can be a major performance hog, as all graphs need to be fully recalculated. Best used with session filtering to concentrate on the data of interest.
- Just to get a feeling: A 10 - 12 MB log file can contain around 10,000 stats lines and, depending on the number of MCUs or CAN nodes, with around 80 values per line → 800,000 points.
- Integrated CAN bus statistics.
- More modern look.
- Known issue: Double-clicks for resetting a zoom are not always picked up reliably. Unfortunately, I have not the slightest clue why. If anyone knows, I’d appreciate it.
Same place: https://sineos.github.io/
Feedback on issues etc is, of course, highly welcome.
Edit:
Pushed some smaller changes:
- Added
bytes_retransmitandbytes_invalidto the graphs. - Removed
upcoming_bytesas it is not so relevant. - Added generic temperature sensors.
- Switched to the Plotly basic library for faster initial loading.